DATA ANALYTICS AND VISUALIZATION
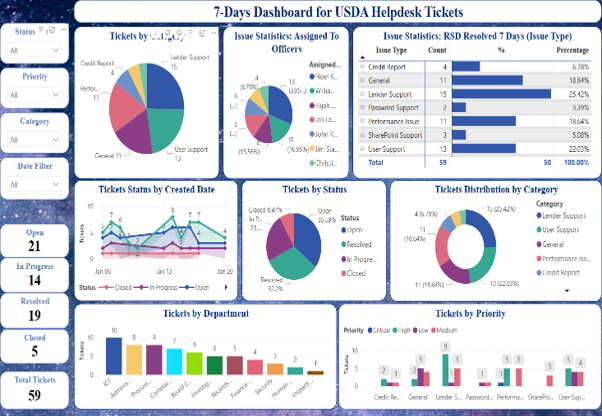
HELPDESK DASHBOARD
Our 7-Day Helpdesk Dashboard provides real-time monitoring of support operations, tracking ticket statuses, team assignments, and issue categories across departments. The interactive visualizations enable managers to optimize resource allocation and improve service delivery through data-driven insights.
Healthcare facility distribution Dashboard
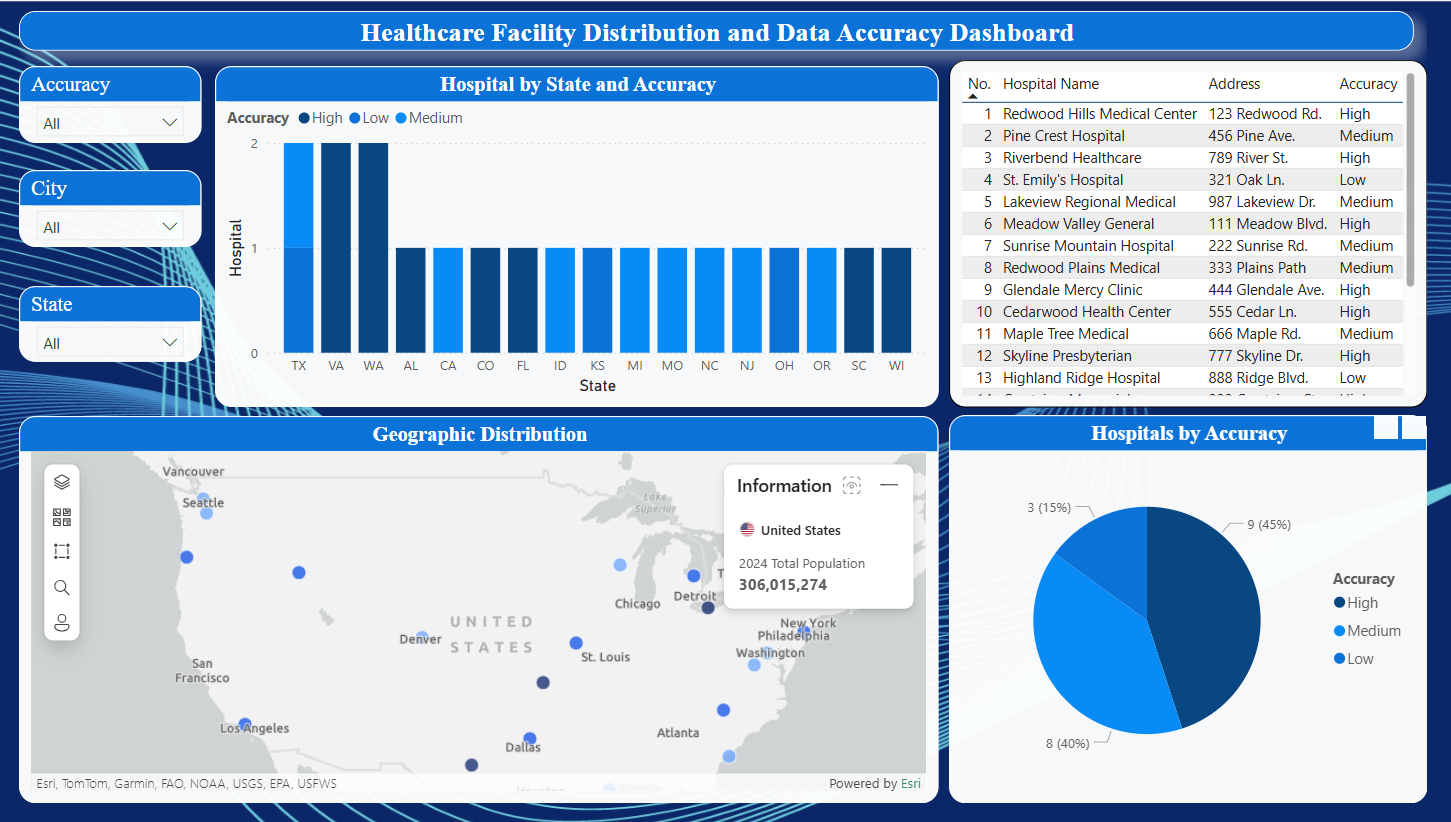
Our Healthcare Facility Distribution Dashboard maps and monitors healthcare facilities across the United States, tracking data accuracy levels for each location. The interactive visualization provides insights into facility distribution by state, with detailed accuracy metrics that help identify areas needing data quality improvements.
ANALYTICS OF PEOPLE DATA DASHBOARD
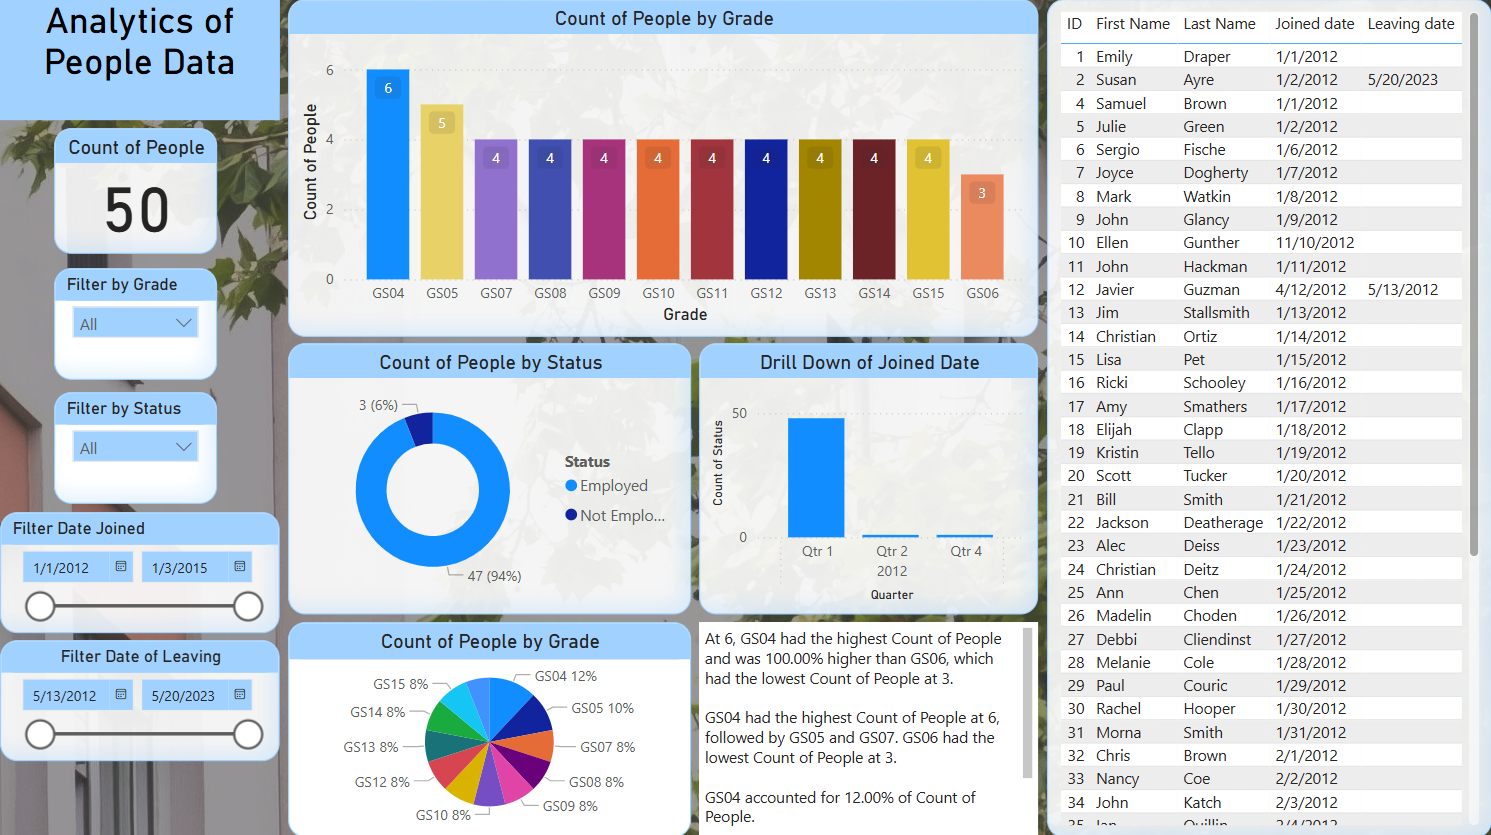
Our People Analytics Dashboard offers comprehensive workforce insights, displaying employee distribution across grades, employment status, and joining patterns. The interactive filters and drill-down capabilities enable HR managers to track employee tenure, analyze workforce composition, and monitor staffing levels across different organizational grades.
Analytics of Employment data DASHBOARD
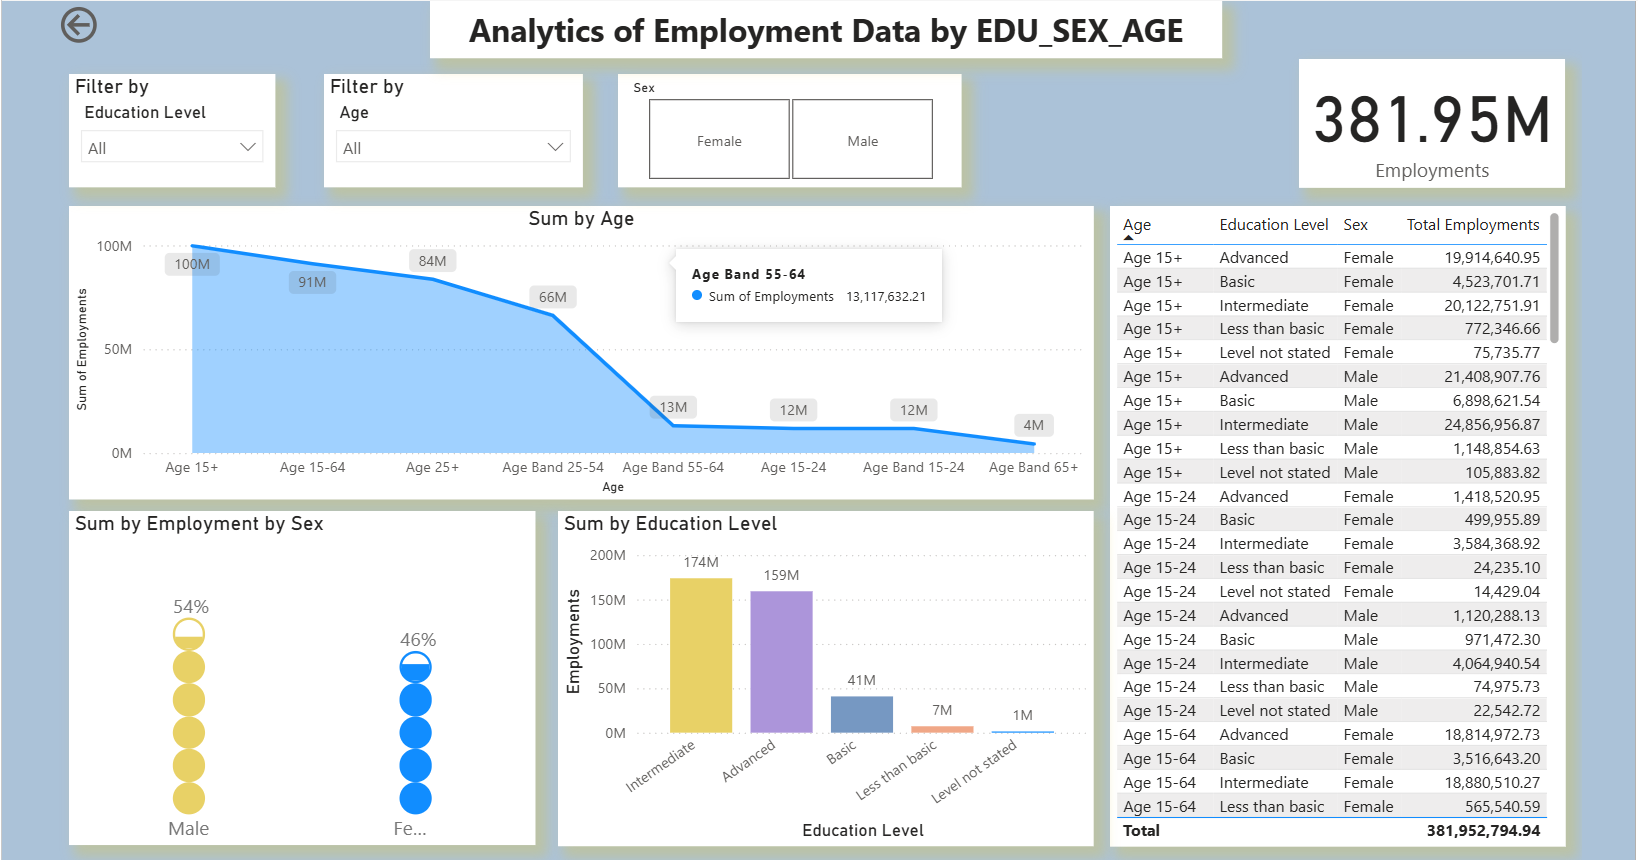
Our Employment Analytics Dashboard provides a comprehensive view of workforce distribution across age groups, education levels, and sex. The interactive filters and visual breakdowns enable policymakers and analysts to explore employment trends by demographic segment, monitor workforce composition, and identify gaps in education and employment access. Key insights include employment concentration among individuals with intermediate and advanced education, a near-equal gender split with a slight male majority, and a sharp decline in employment in older age brackets. This dashboard supports data-driven decisions to enhance inclusive and equitable labor market policies.
gis visualizations
Example 1: Travel Pattern Analysis between Office Hubs
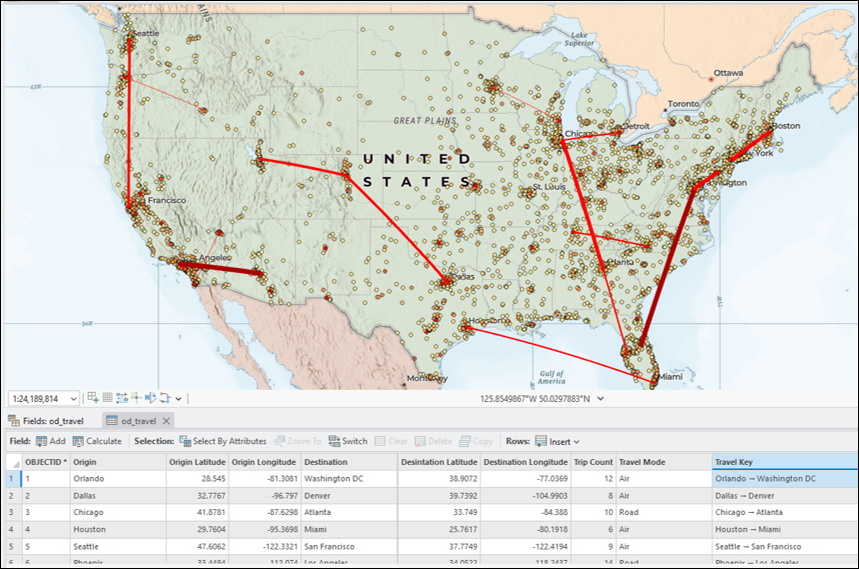
Analyzing origin–destination flows highlights how personnel, funds, or assets move between different locations. In investigations, travel flow maps can uncover unusual or suspicious movement patterns, such as disproportionately frequent trips between certain offices and vendors, or repeated high-volume travel tied to specific contracts. These can trigger deeper audits or investigative inquiries.
From an audit standpoint, flow analysis helps identify inefficiencies in how resources are deployed. For example, auditors can use OD flows to reveal redundant travel routes or excessive costs associated with particular patterns. By visualizing these flows geospatially, government offices gain actionable insight into travel-related risks, compliance issues, and potential cost-saving opportunities.
* Generated using dummy data
* Generated using dummy data
Example 2: Government Contract Spending by Geography
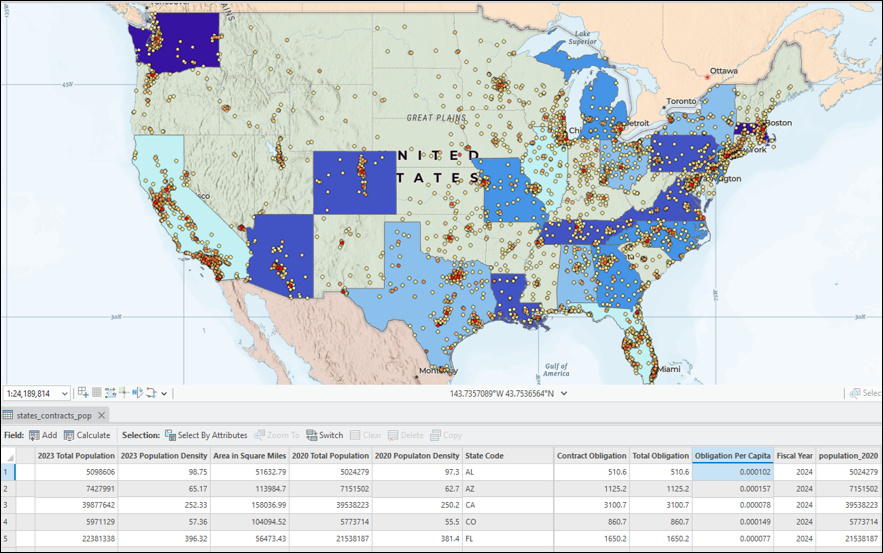
Mapping contract spending by state or region provides a clear view of where government dollars are flowing. Raw totals allow leadership to see which regions receive the most obligations, while per-capita normalization reveals whether certain areas are receiving disproportionately high or low levels of funding relative to their population. Both views are critical to ensuring fairness, transparency, and alignment with policy objectives.
For audit and investigative units, these maps serve as a powerful screening tool. Areas with unusually high per-capita spending can be flagged for further audit, while unexpected discrepancies between funding levels and expected outcomes may indicate inefficiencies, mismanagement, or even fraud. By combining contract data with geographic context, agencies can improve oversight and demonstrate stewardship of public resources.
Example 3: Optimized Vehicle Routing Problem
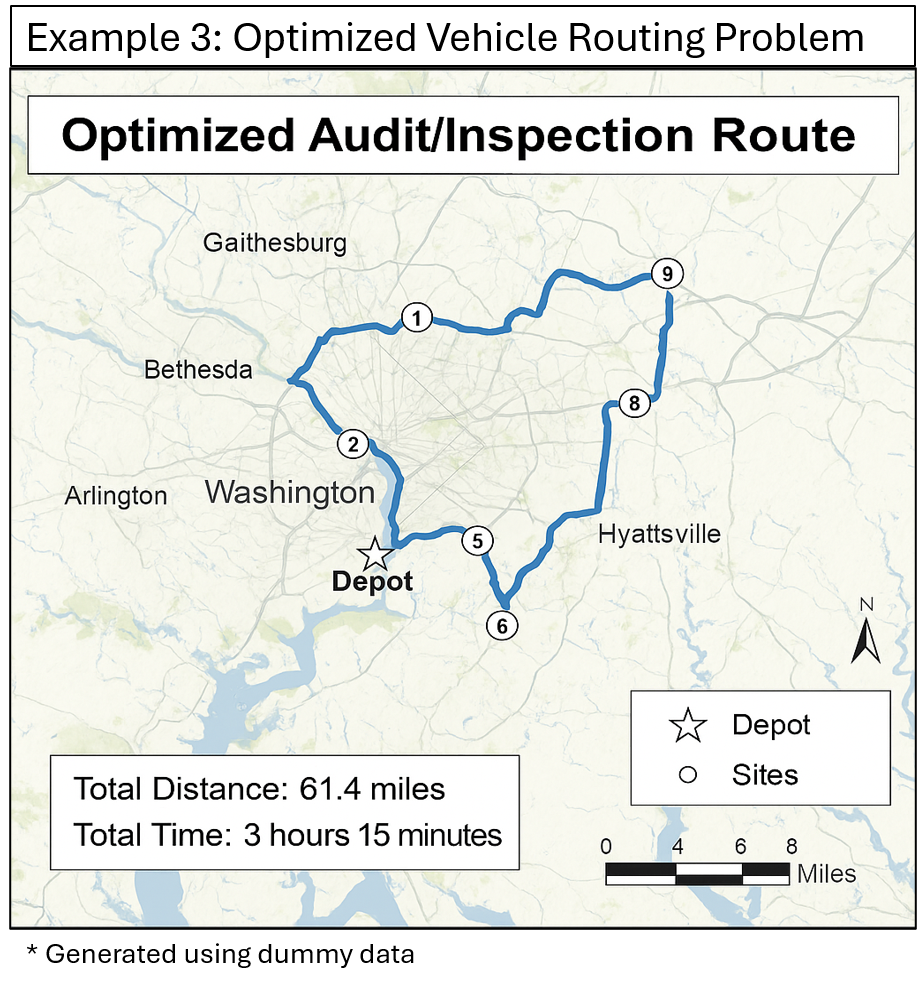
Routing analysis ensures that auditors and investigators can visit multiple sites efficiently. By using optimization tools, agencies can minimize travel time and costs, while still meeting required service levels or priorities. For example, a depot-to-sites route analysis can guarantee that audits or inspections are completed in logical sequence, saving time and reducing logistical overhead.
For government offices, optimized routing translates into measurable benefits: fewer travel expenses, reduced fatigue for staff, and more audits or inspections completed in a given timeframe. Beyond efficiency, routing also supports accountability — showing that oversight activities are planned and executed using defensible, data-driven methods. In contexts where investigations require timely response, optimized routing ensures that teams arrive quickly and cover more ground, strengthening both compliance and enforcement.
